Today, I started my work by watching the above given an insightful video lecture by Anurag Bhargava on the topic of RF Practical Power Amplifier Design. This video provided a deep theoretical background on how to analyze and interpret amplifier stability using S-parameters. It introduced essential concepts such as K-factor, Mu factors, and stability circles, which are critical to designing reliable RF amplifiers.
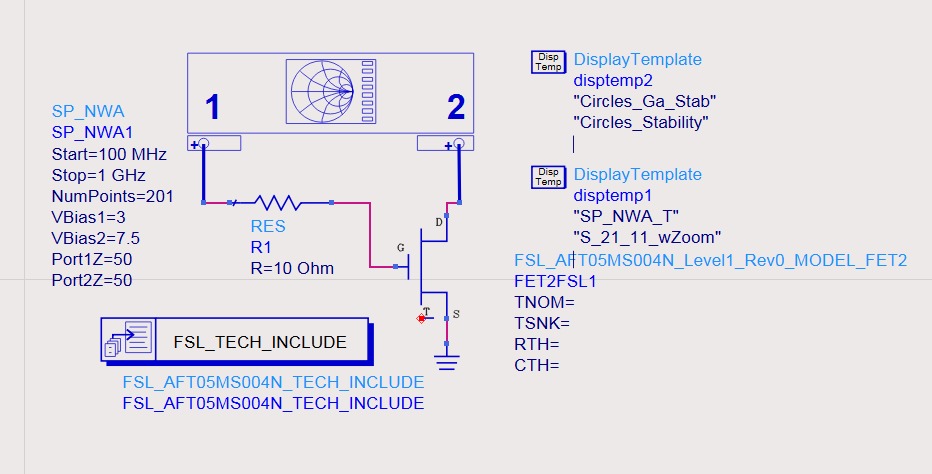
FIG 1: Schematic of Stability Analysis of AFT05MS004N in ADS 2023
After reviewing the theory, I implemented the practical part using ADS 2023. I selected the AFT05MS004N LDMOS transistor model for simulation and set up an S-parameter analysis over a frequency range from 100 MHz to 1 GHz, using 201 points. The gate and drain were biased at Vgs = 3 V and Vds = 7.5 V, respectively, matching the recommended operating conditions. I also placed a 10-ohm resistor at the gate to improve stability.
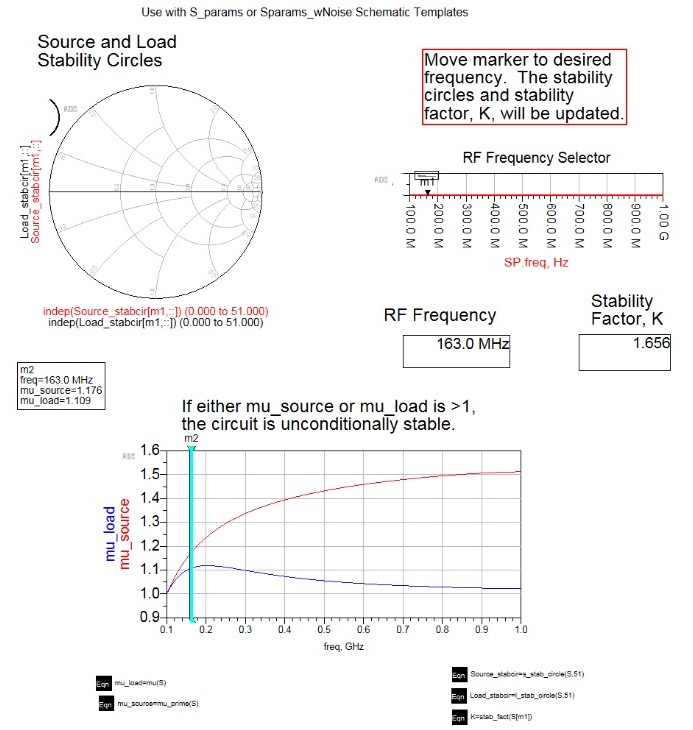
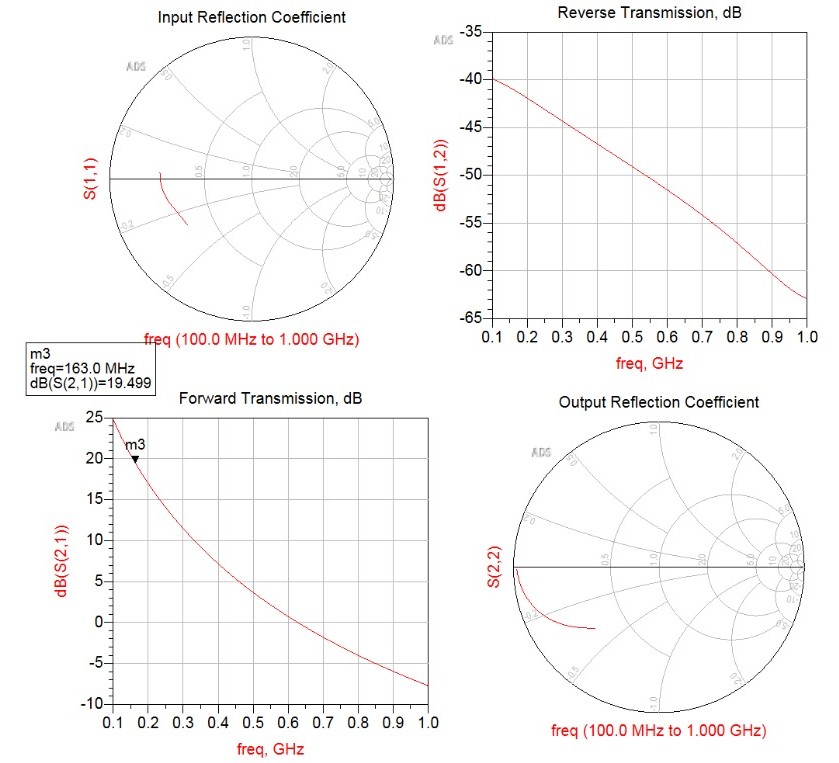
FIG 2: Simulation of Stabilty Analysis Using Circles_Stability and SP_NWA_T DDS Display Template
For evaluating stability, I used the Circles_Stability display template in ADS. This automatically plotted the source and load stability circles, calculated the stability factor (K), and also plotted the Mu parameters over the frequency range. I set a marker at 163 MHz, close to my design target of 161 MHz, to observe the values of interest. At 163 MHz, Stability Factor K = 1.656, Mu Source μ_source = 1.176,Mu Load μ_load = 1.109. These values are very promising. According to standard RF design guidelines, a circuit is unconditionally stable if K>1 and both Mu factors>1. In my case, all these conditions are satisfied, confirming that the amplifier is stable at this frequency and bias point.
The Smith Chart in the template shows stability circles that define the regions of potential instability. If the load or source impedance lies inside the shaded unstable region, the circuit may oscillate. However, my operating point lies well outside the instability zones, which means I have good margins and flexibility in choosing my matching network. This visual confirmation adds confidence to the numerical results. Today’s simulation confirms that my amplifier design using the AFT05MS004N transistor is unconditionally stable at 163 MHz, which is very close to my target of 161 MHz. This sets a solid foundation for the next stages of design.
After completing the stability check, I used the SP_NWA_T DDS display template in ADS to evaluate the S-parameters of the AFT05MS004N transistor. This included forward gain (S21), reverse isolation (S12), and input/output reflection (S11 and S22), which are key to understanding how well the transistor behaves under small-signal conditions.
At 163 MHz, the forward gain (S21) is about 19.5 dB, which indicates strong amplification. The reverse transmission (S12) is below -40 dB, meaning there’s very little feedback from output to input—this supports good amplifier stability.
The Smith charts for S11 and S22 show that the input and output are not perfectly matched but are within a reasonable range. Some improvement in matching networks will be needed to reduce reflection and increase power transfer. These S-parameter results confirm that the transistor provides good gain and isolation. The next step will be to design proper matching networks to optimize performance further and prepare for power and efficiency simulations.
With the stability and small-signal behavior confirmed, the next step in my amplifier design process will be to perform load-pull analysis. This will help determine the optimal load impedance for maximum power output and efficiency. Based on those results, I will proceed to design the input and output matching networks, moving into the second part of the amplifier design. This next phase will bring me closer to building a high-efficiency RF power amplifier centered around the AFT05MS004N transistor.
Final Corrections:
Following the loadline-based DC-IV analysis and parameter extraction, I moved on to the stability analysis of the AFT05MS004N transistor at my target frequency of 161 MHz. Using the S-parameter setup in ADS 2023, I ensured that the device was properly biased at VGS = 3.3 V and VDS = 7.5 V using a 7 Ω resistor in series with the drain.
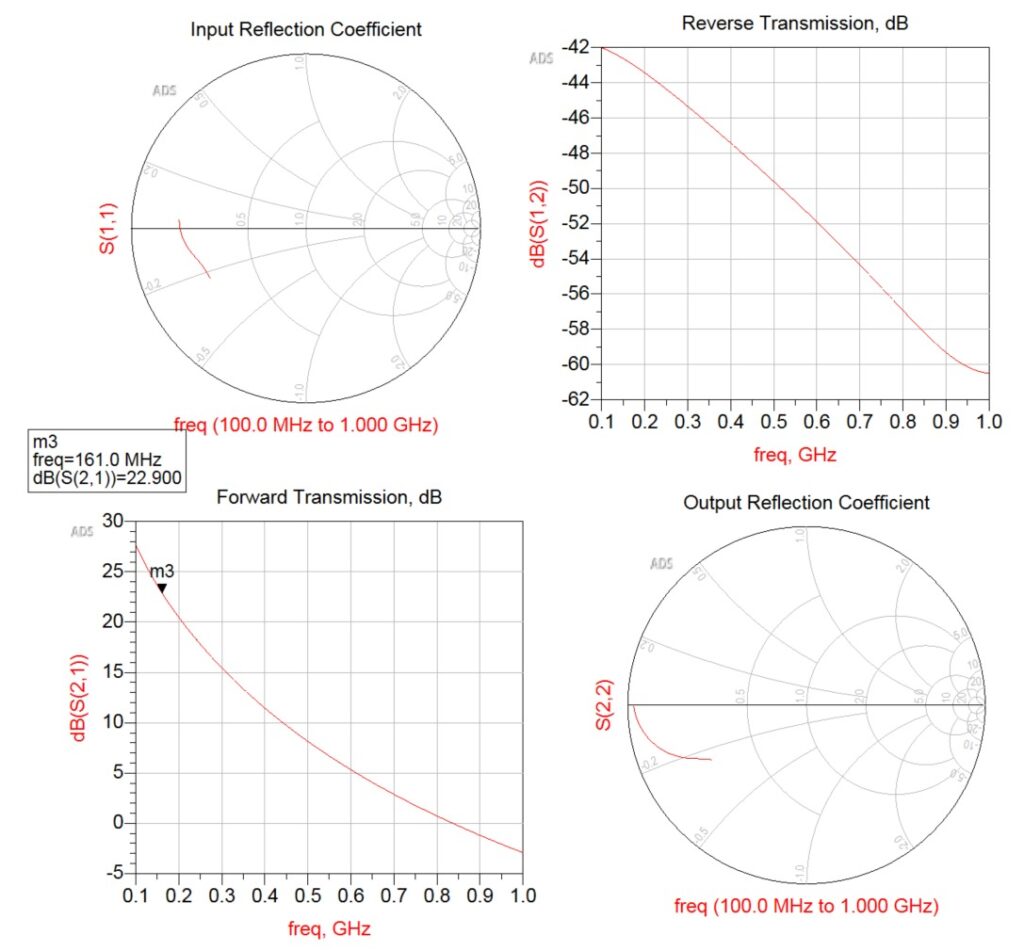
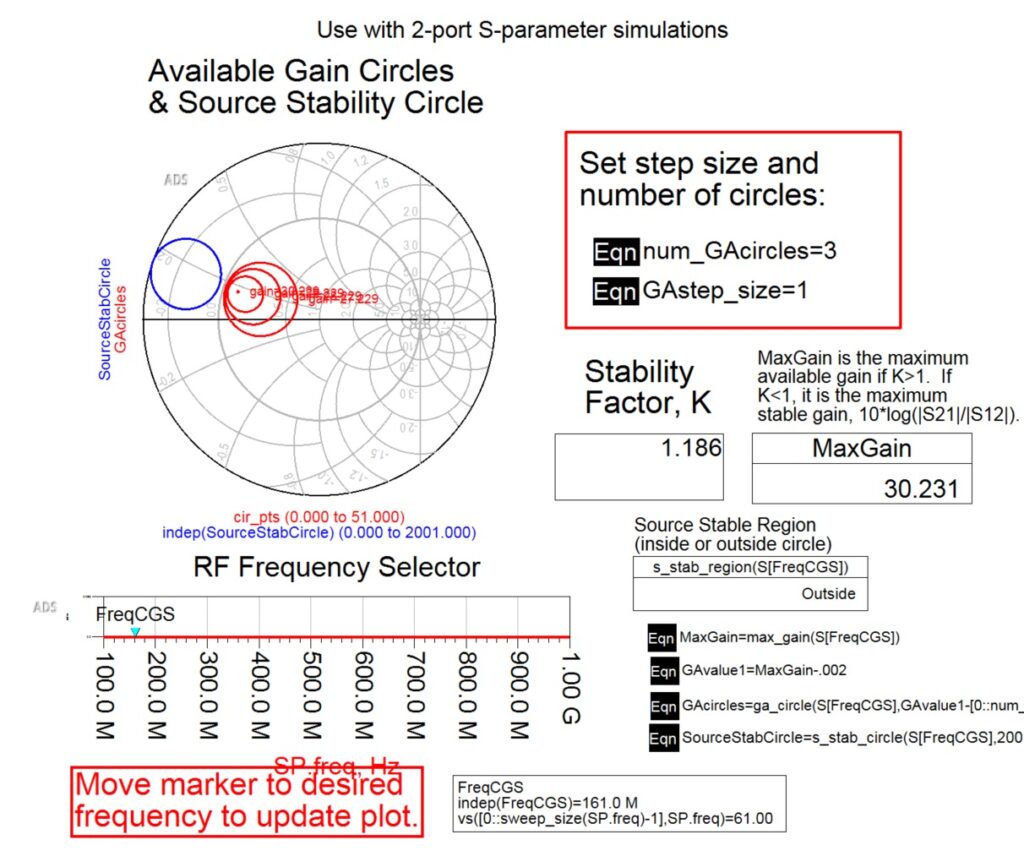
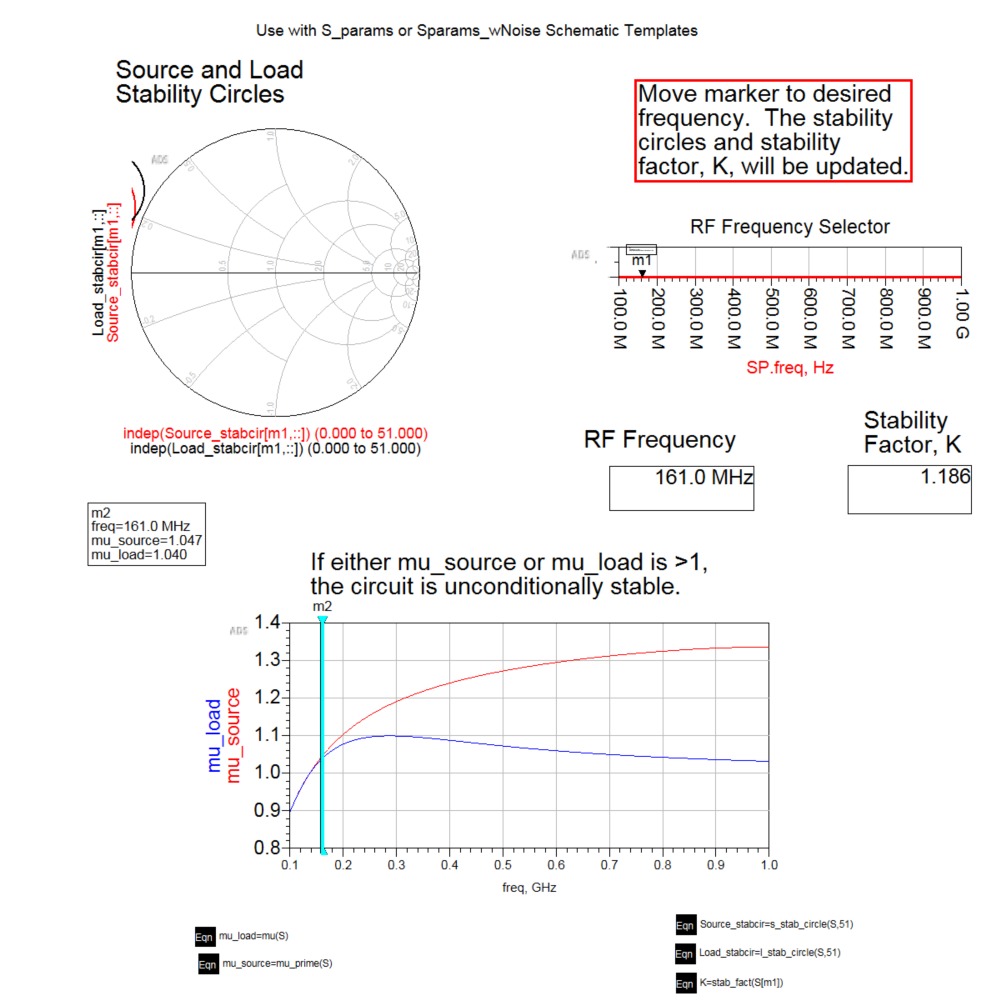
FIG 3: Simulation of Stabilty Analysis Using Circles_Stability and SP_NWA_T DDS Display Template
Key Results from Final Stability Analysis:
| Parameter | Value |
| Stability Factor (K) | 1.186 |
| μ (Mu) Source | 1.047 |
| μ (Mu) Load | 1.040 |
| Frequency | 161 MHz |
| Max Available Gain (MAG) | 30.231 dB |
- Since both μ_source > 1 and μ_load > 1, and the K-factor is greater than 1, the circuit is unconditionally stable at the operating frequency.
- The stability circles plotted on the Smith chart confirm that the source and load reflection coefficients lie outside the unstable regions.
- The available gain circles show a max gain potential of 30.23 dB, which gives a useful upper bound for designing matching networks.
- The S-parameter plots confirm good forward transmission (S21 = 22.9 dB) and very low reverse isolation (S12 ≈ -60 dB) at 161 MHz.
The corrected simulation and the updated DDS stability templates now give me complete confidence in my analysis environment. With verified DC biasing, extracted amplifier metrics, and confirmed unconditional stability, I’m ready to proceed to the load-pull analysis stage. This will help determine the optimal load impedance for maximum power and efficiency, feeding directly into the final Class AB amplifier design and matching network synthesis.
Leave a Reply